Rising West Coast Port Congestion Lengthens Import Lead Times for Transpacific Buyers

Chassis shortages and record import volumes at West Coast docks extend turn times and increase local trucking costs for buyers.
29.08.26 2 min

Briefing

Record import volumes at major West Coast terminals are pulling chassis out of circulation and dragging out container dwell times. For buyers, that bottleneck lengthens the window between vessel arrival and warehouse availability while pushing up local storage and drayage fees. Traffic across Los Angeles and Long Beach has left containers sitting on docks as rail and trucking networks struggle to clear the backlog. Average ship stays at those facilities reached nearly four days during the recent peak.

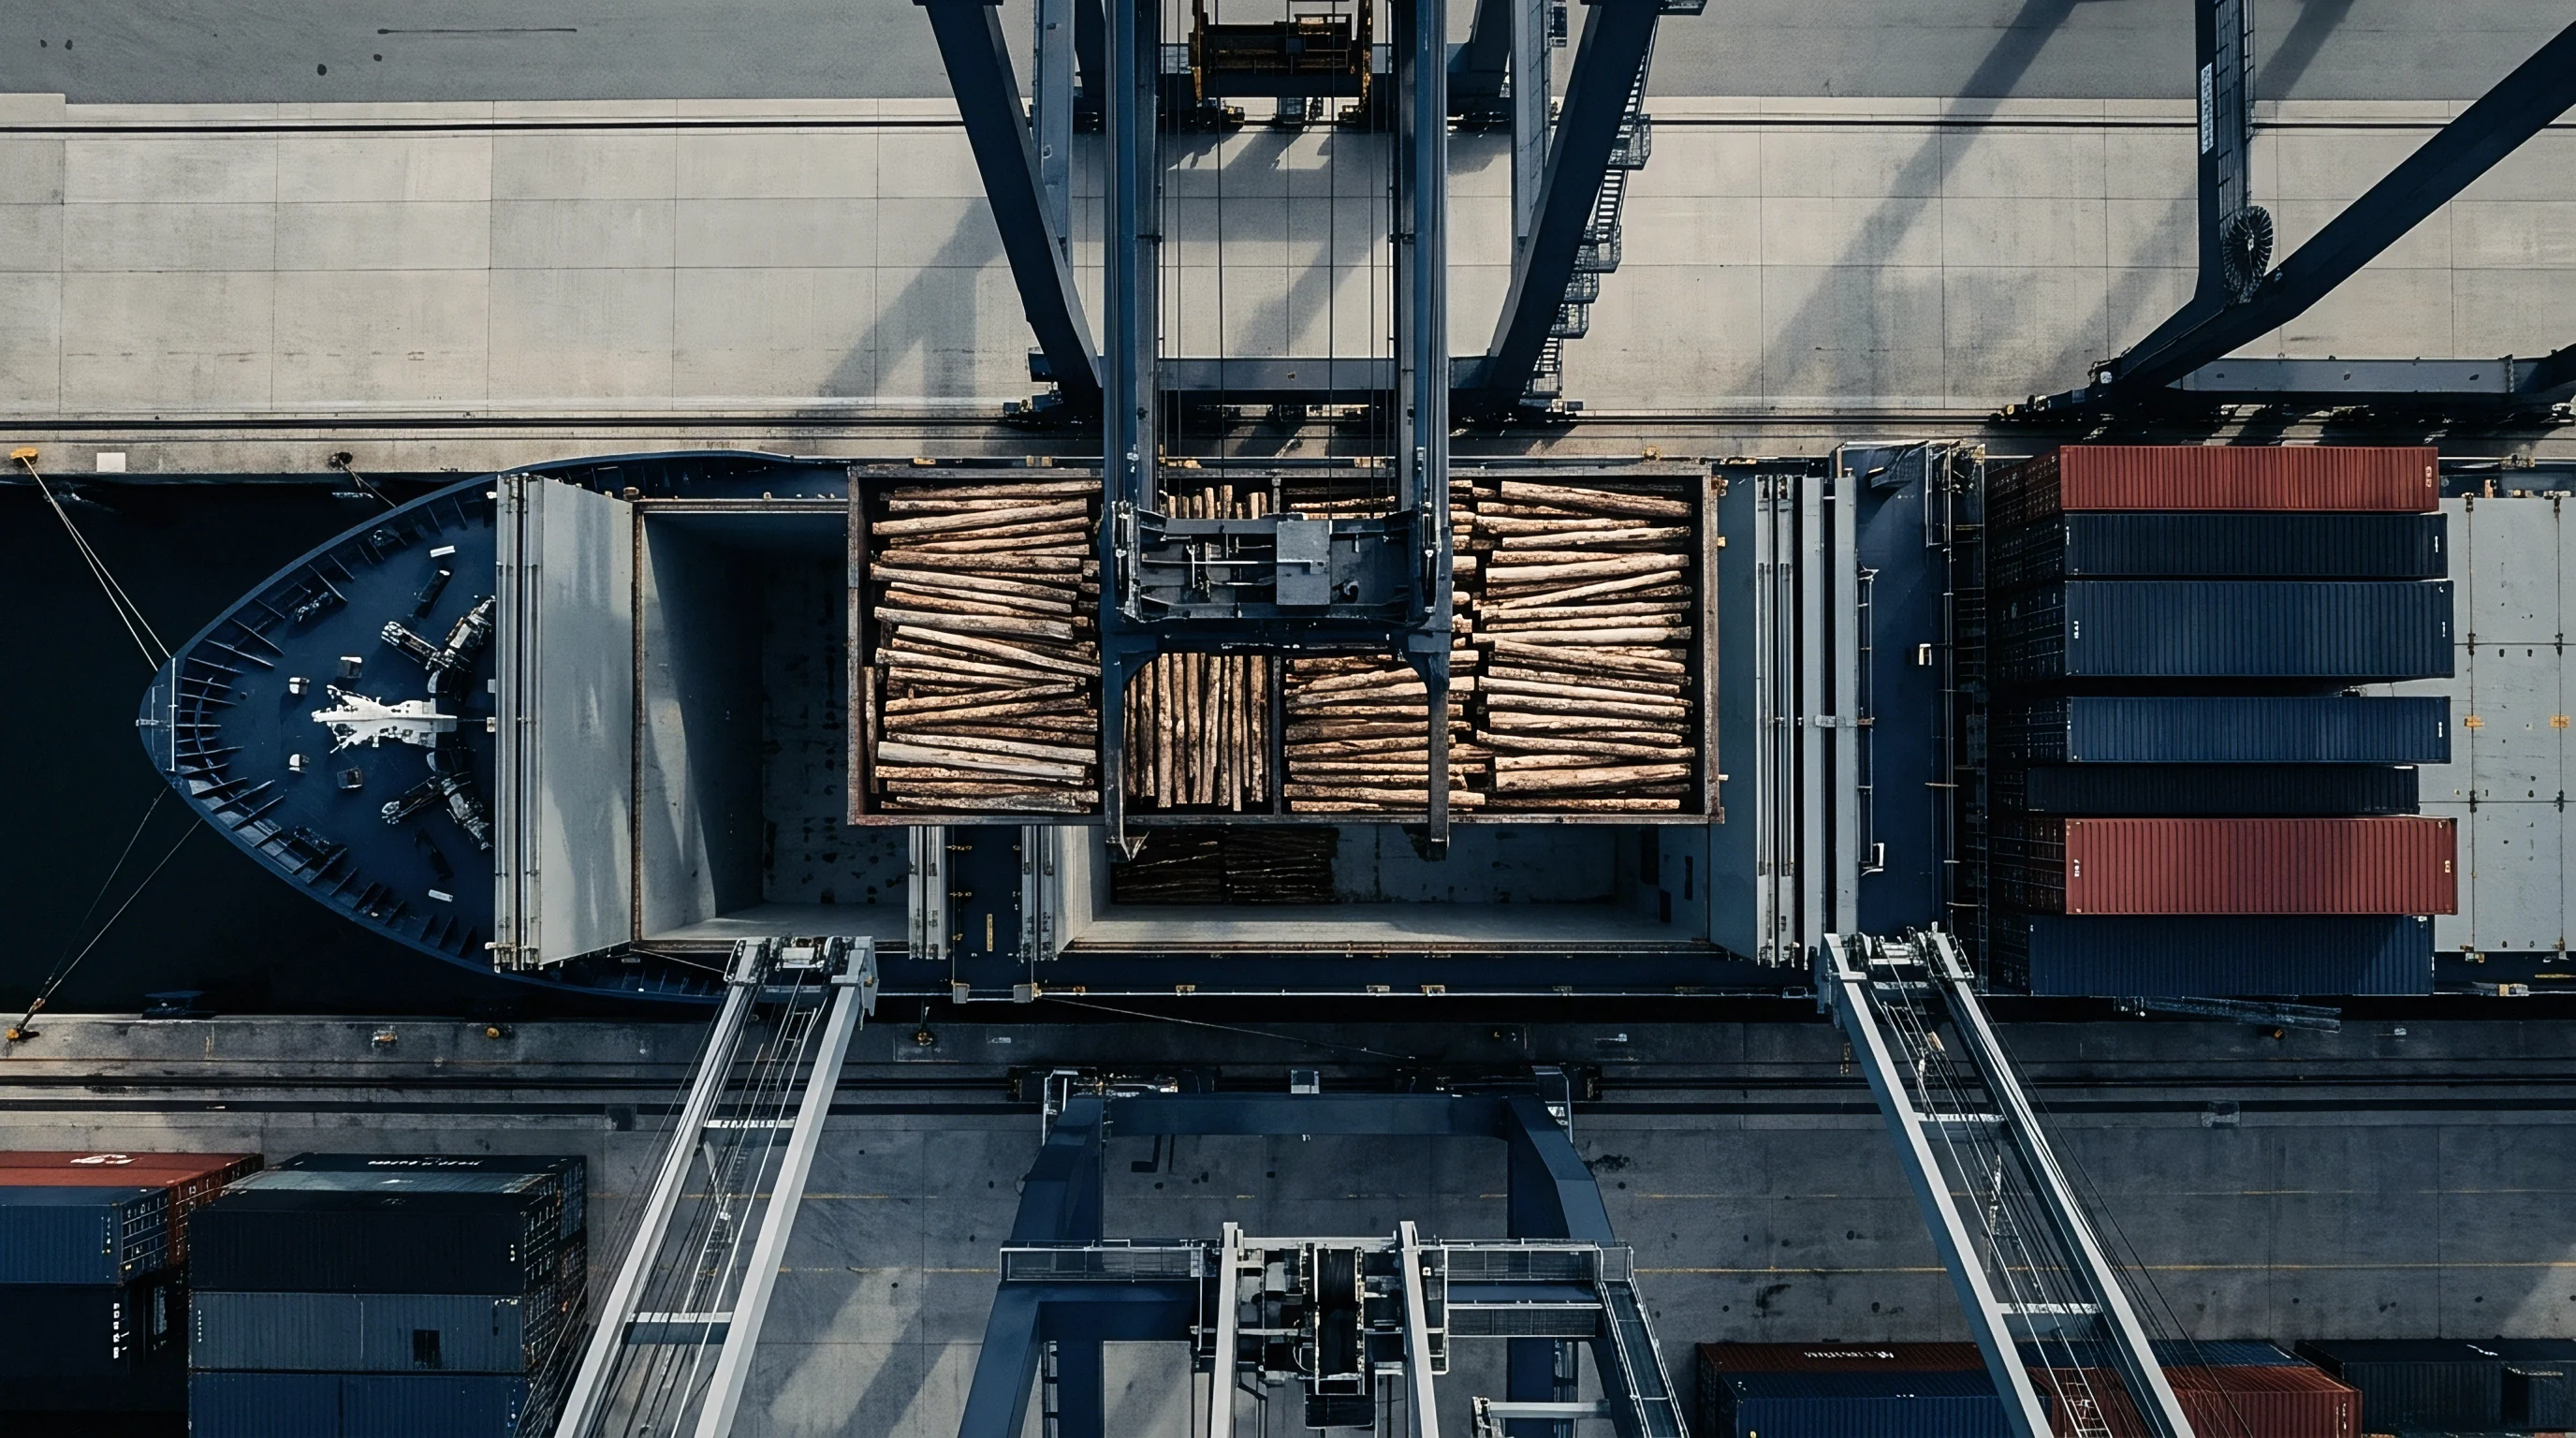
A gloved worker uses a metal scribe to apply identifying marks onto a cast component inside an active production facility.

Context

Procurement desks expected a manageable rise in arrivals for the typical peak season window. The main question was whether cargo shifting away from East Coast ports would overload terminal infrastructure despite recent capital improvements.

A digital render presents a heavy subsea energy dome suspended inside a structural steel testing rig upon a dark industrial pier.

Analysis

Heavy arrival sequences push terminal capacity past eighty percent utilization, the point where operational efficiency drops off. As container stacks build up, terminal operators have to shuffle boxes repeatedly to reach specific units, delaying yard clearance. That lag slows chassis returns to the pool. Without chassis ready, offloaded containers sit on the ground and block space needed for incoming vessels, leaving buyers to absorb higher wait-time surcharges and delayed inland deliveries.
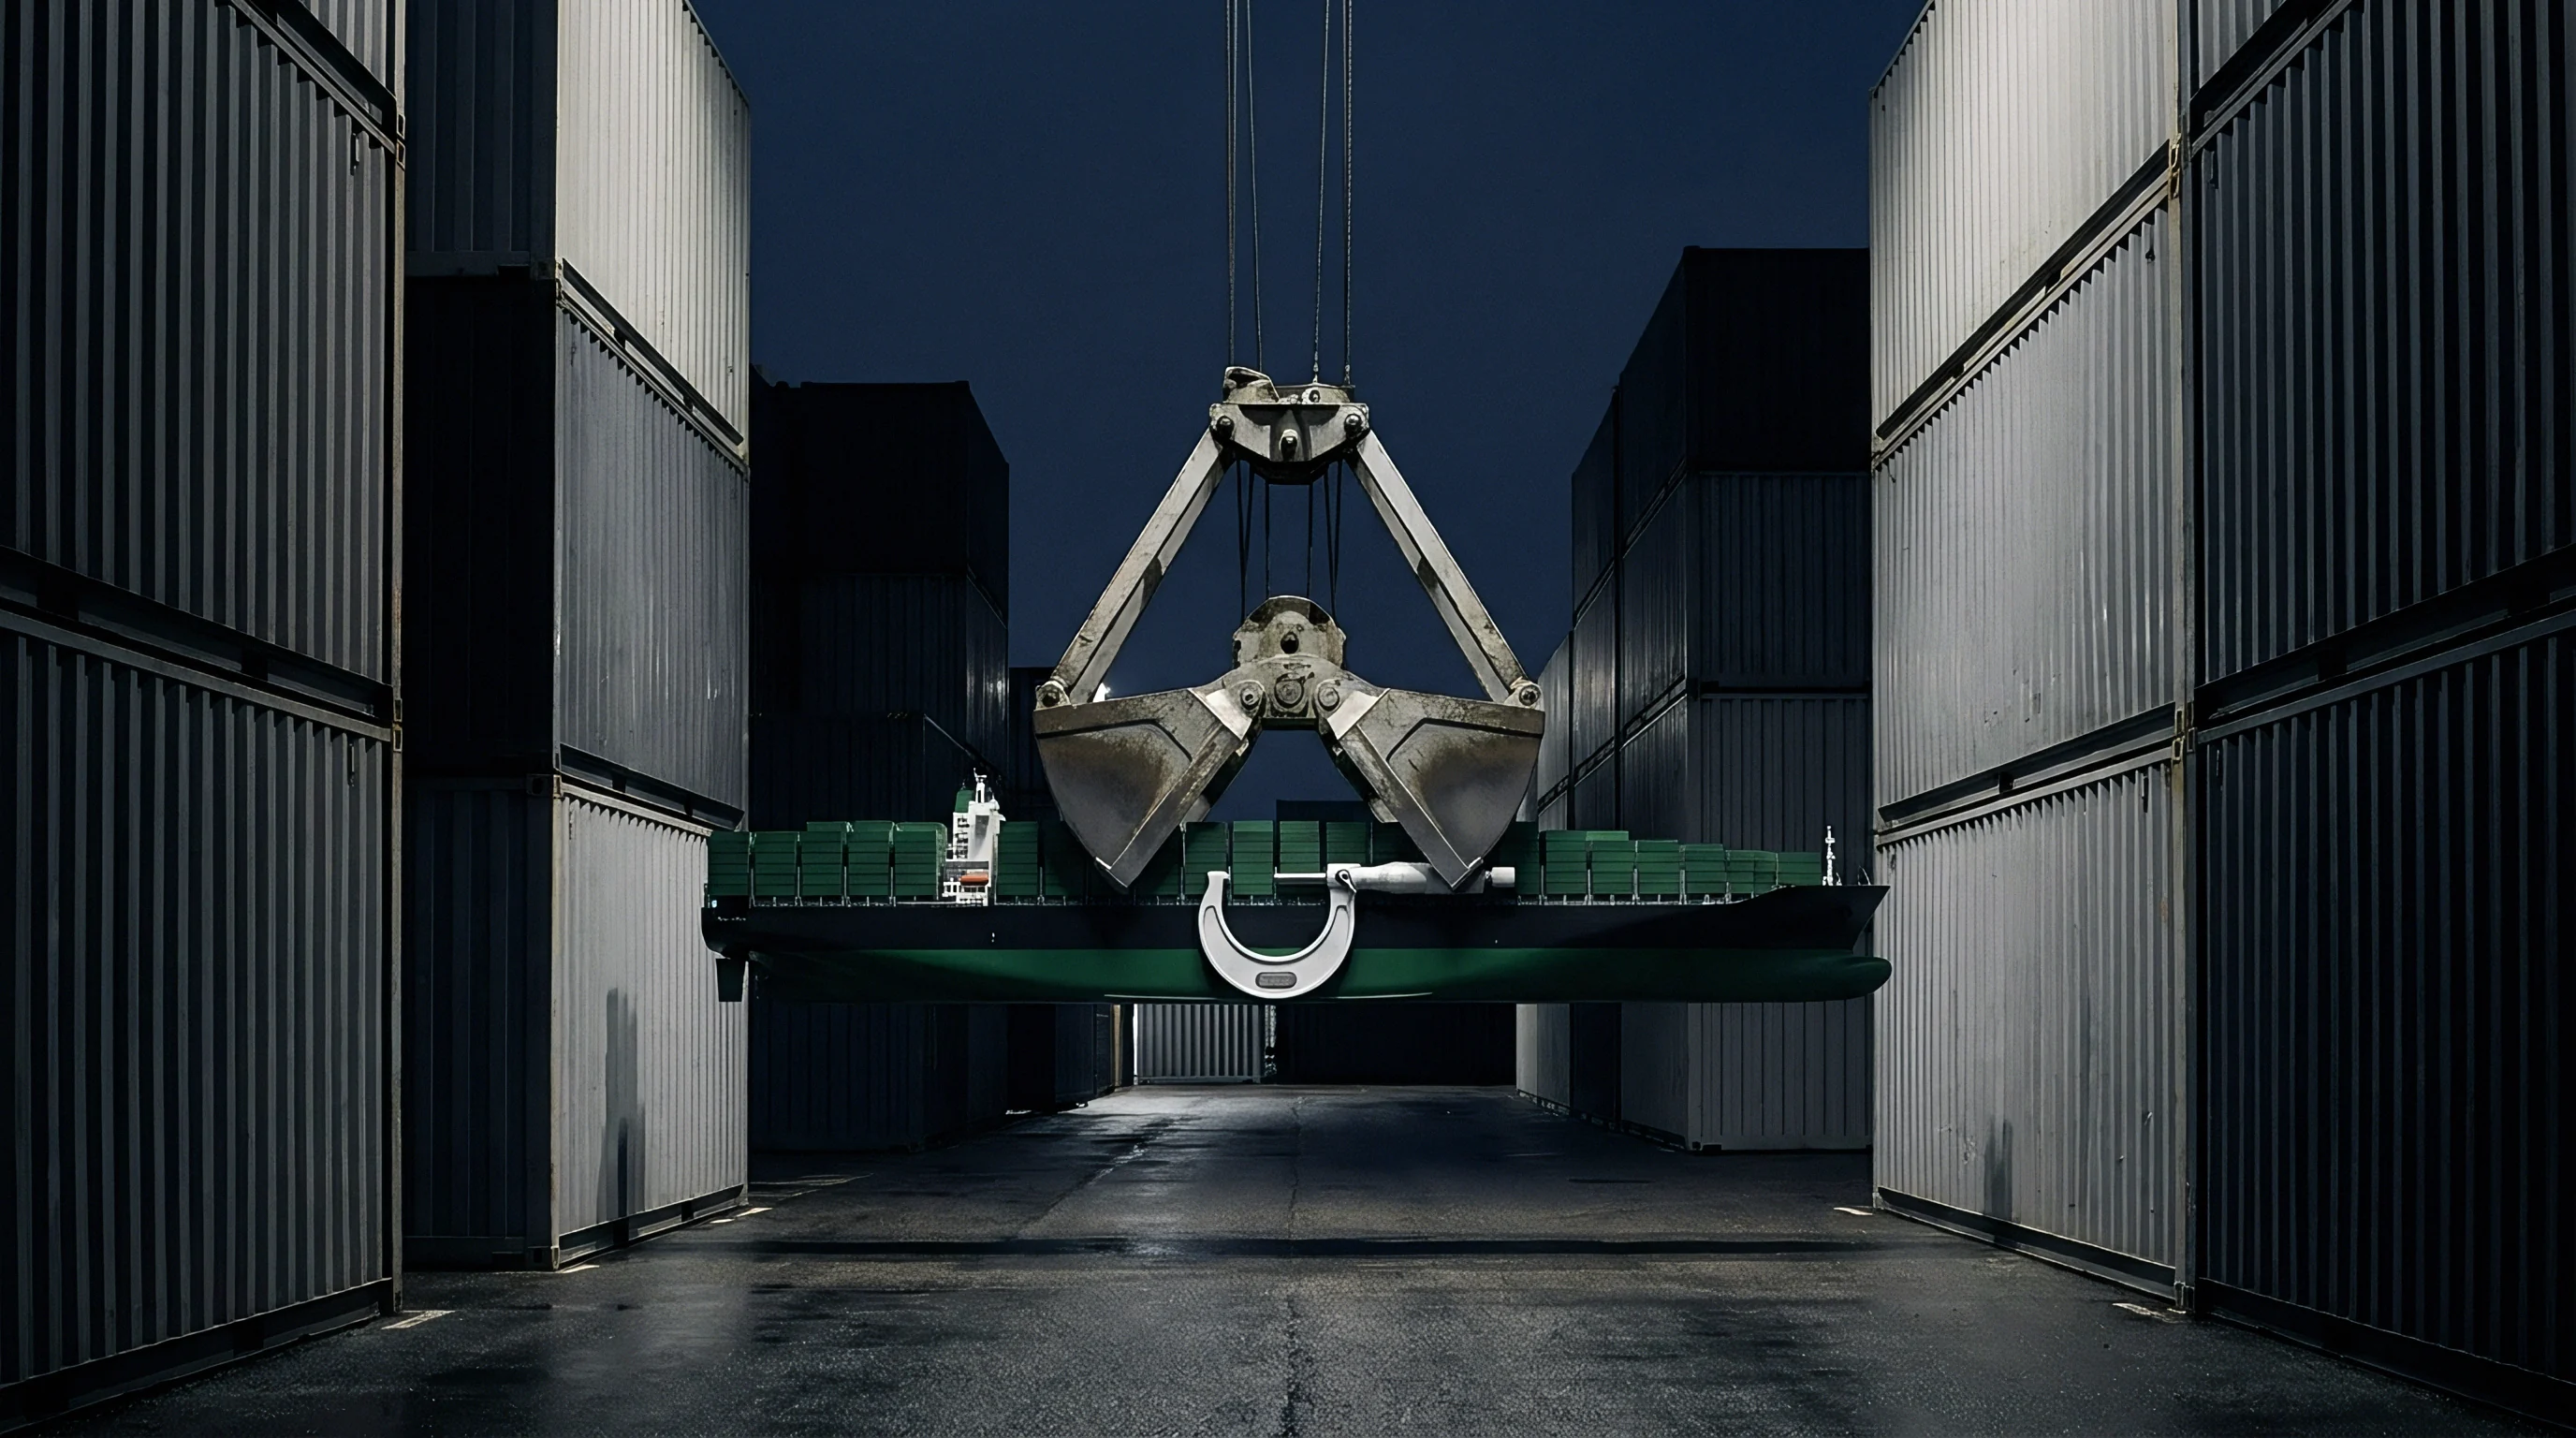
A digital render shows an industrial crane lifting a model cargo vessel between towering steel shipping containers inside a dark terminal warehouse.

Parameters

  • Average Vessel Wait Time ~ 3.7 days is the current average berthing delay at primary West Coast terminals during peak arrival windows.
  • Terminal Utilization Level ~ 85 percent current occupancy across major container yards, well past the point where operational efficiency degrades.
  • Rail Dwell Duration ~ 5.2 days on dock before a container gets loaded onto an eastbound train.
  • Chassis Turnaround ~ 9 days average equipment turnaround out of the port pool during high-demand cycles.
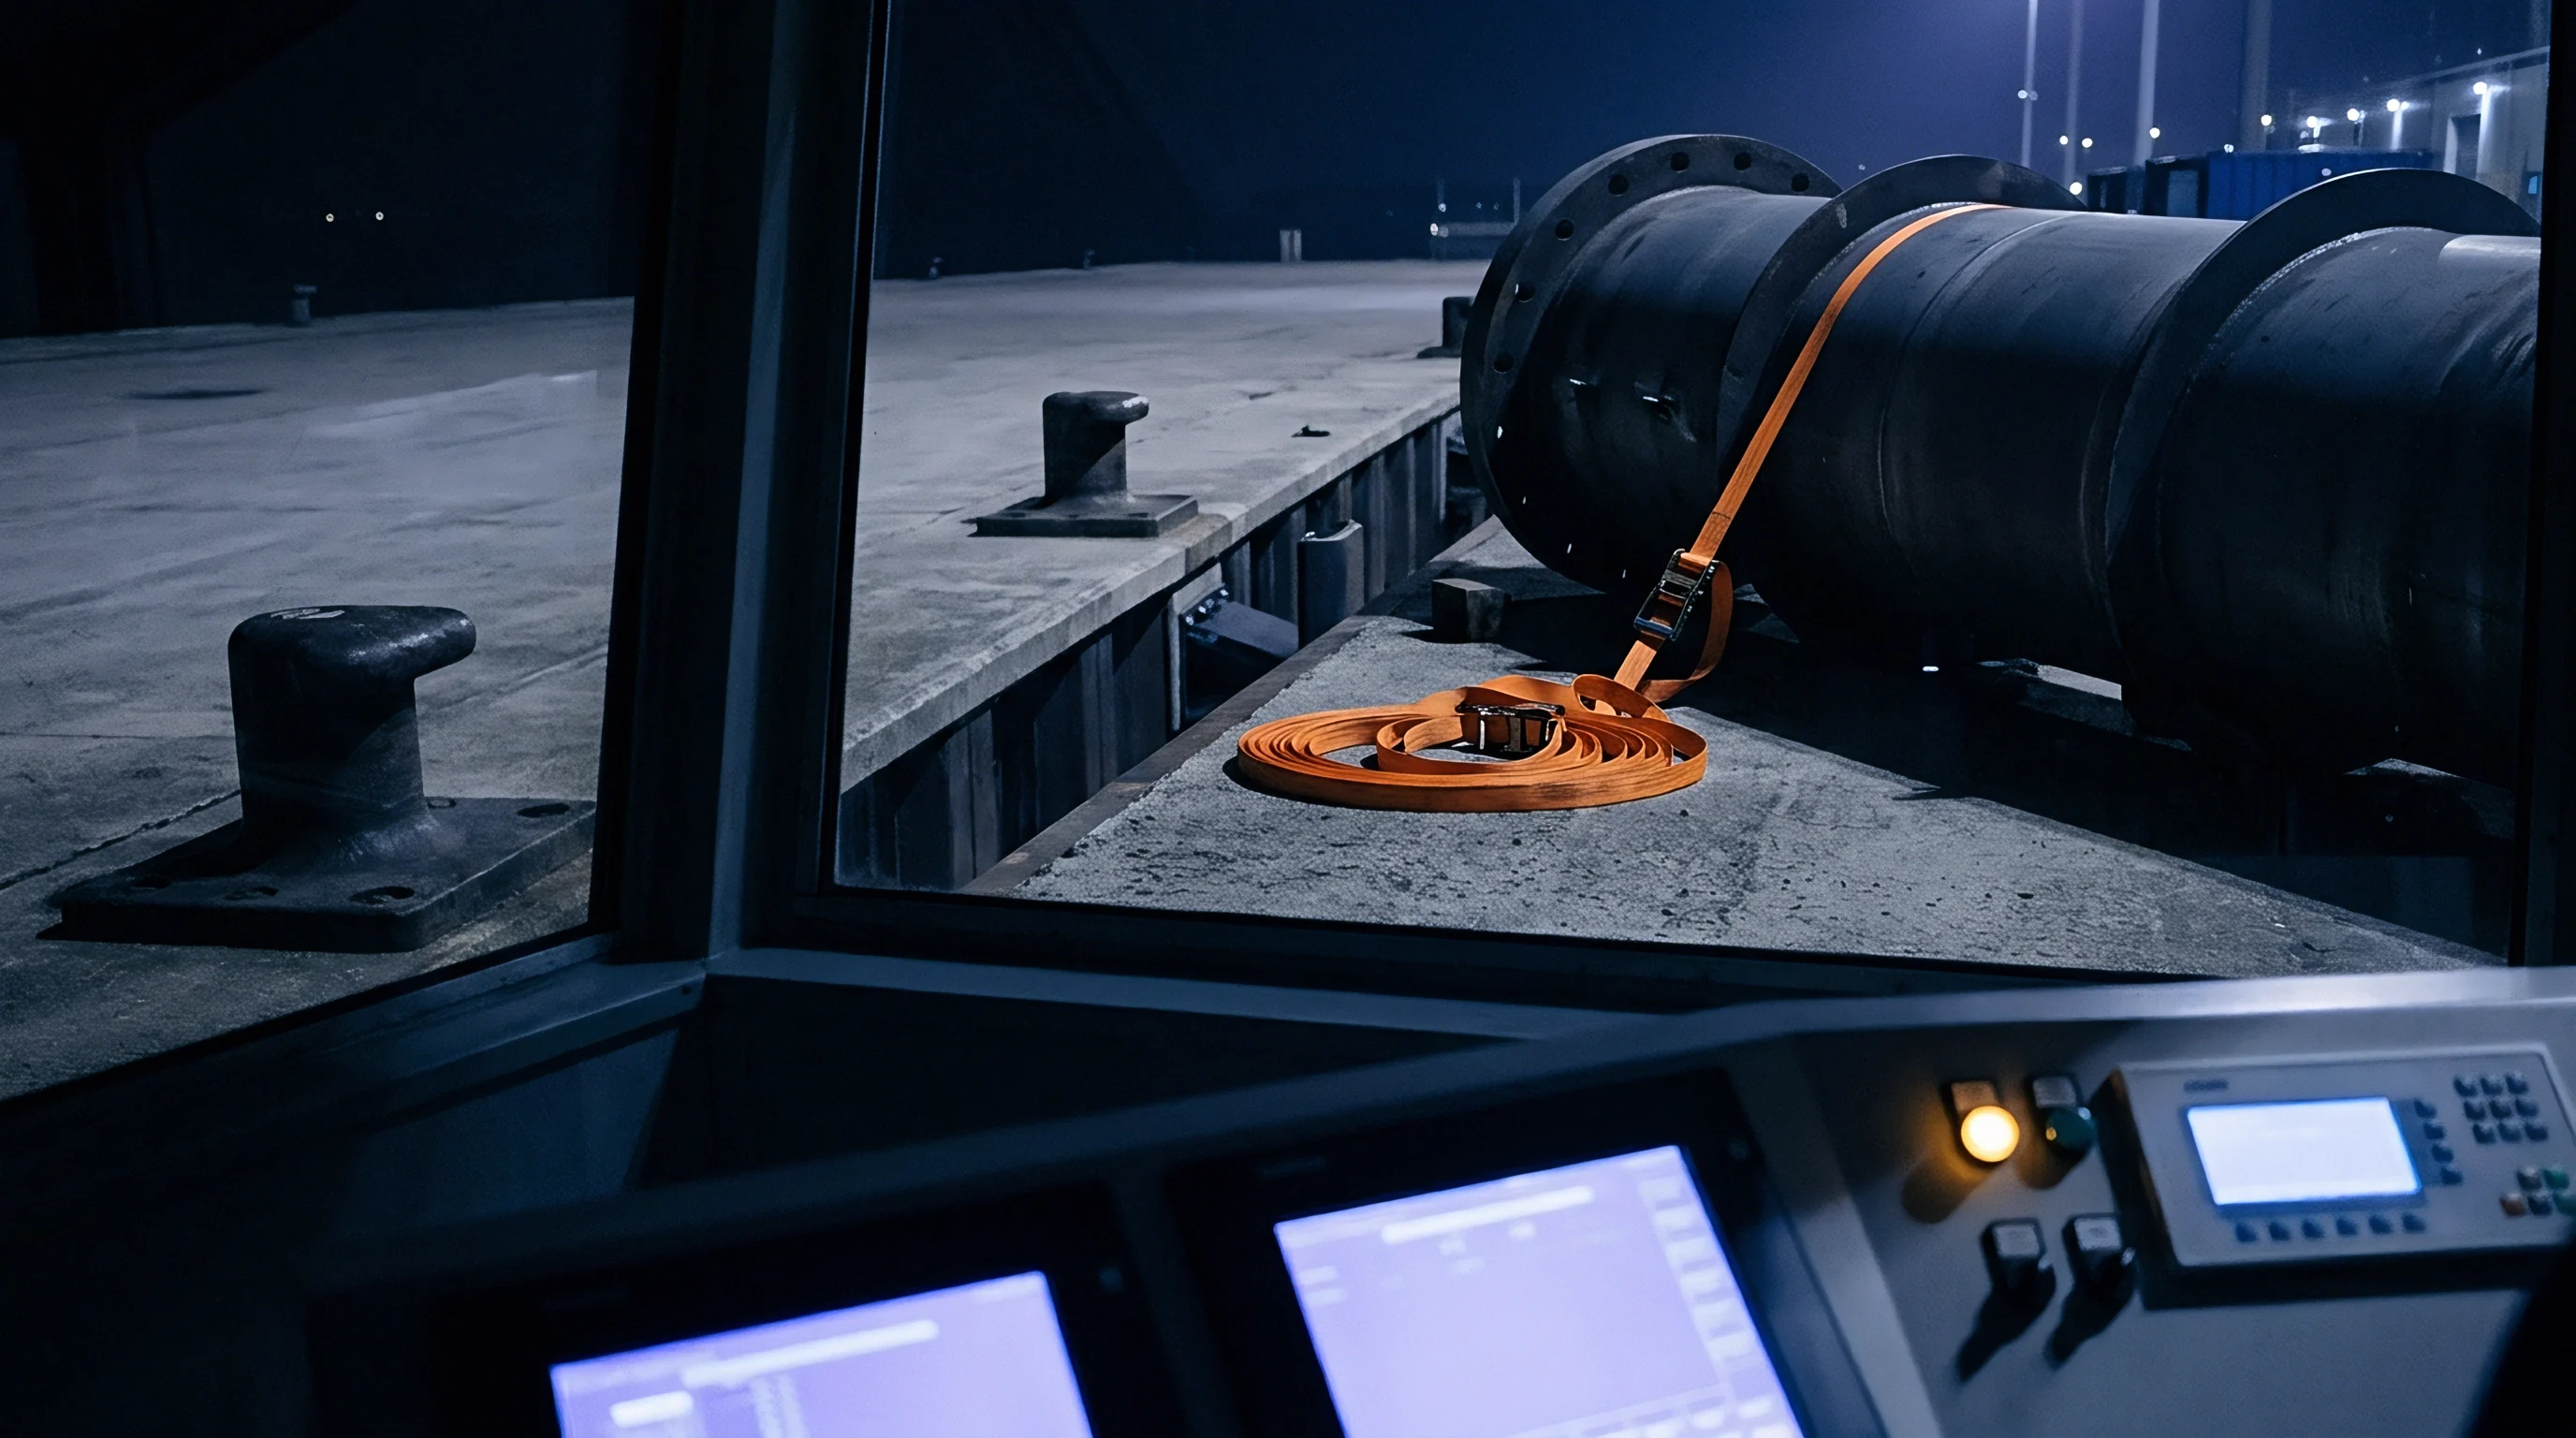
Heavy cylindrical cargo rests on a concrete port terminal visible through the illuminated control console of a maritime facility.

Outlook

Congestion will likely remain elevated into mid-fourth quarter while retailers finish positioning holiday inventory. Buyers should track Pacific Merchant Shipping Association monthly dwell time data. A sustained move above six days in rail dwell will signal systemic backups that will disrupt winter delivery schedules.
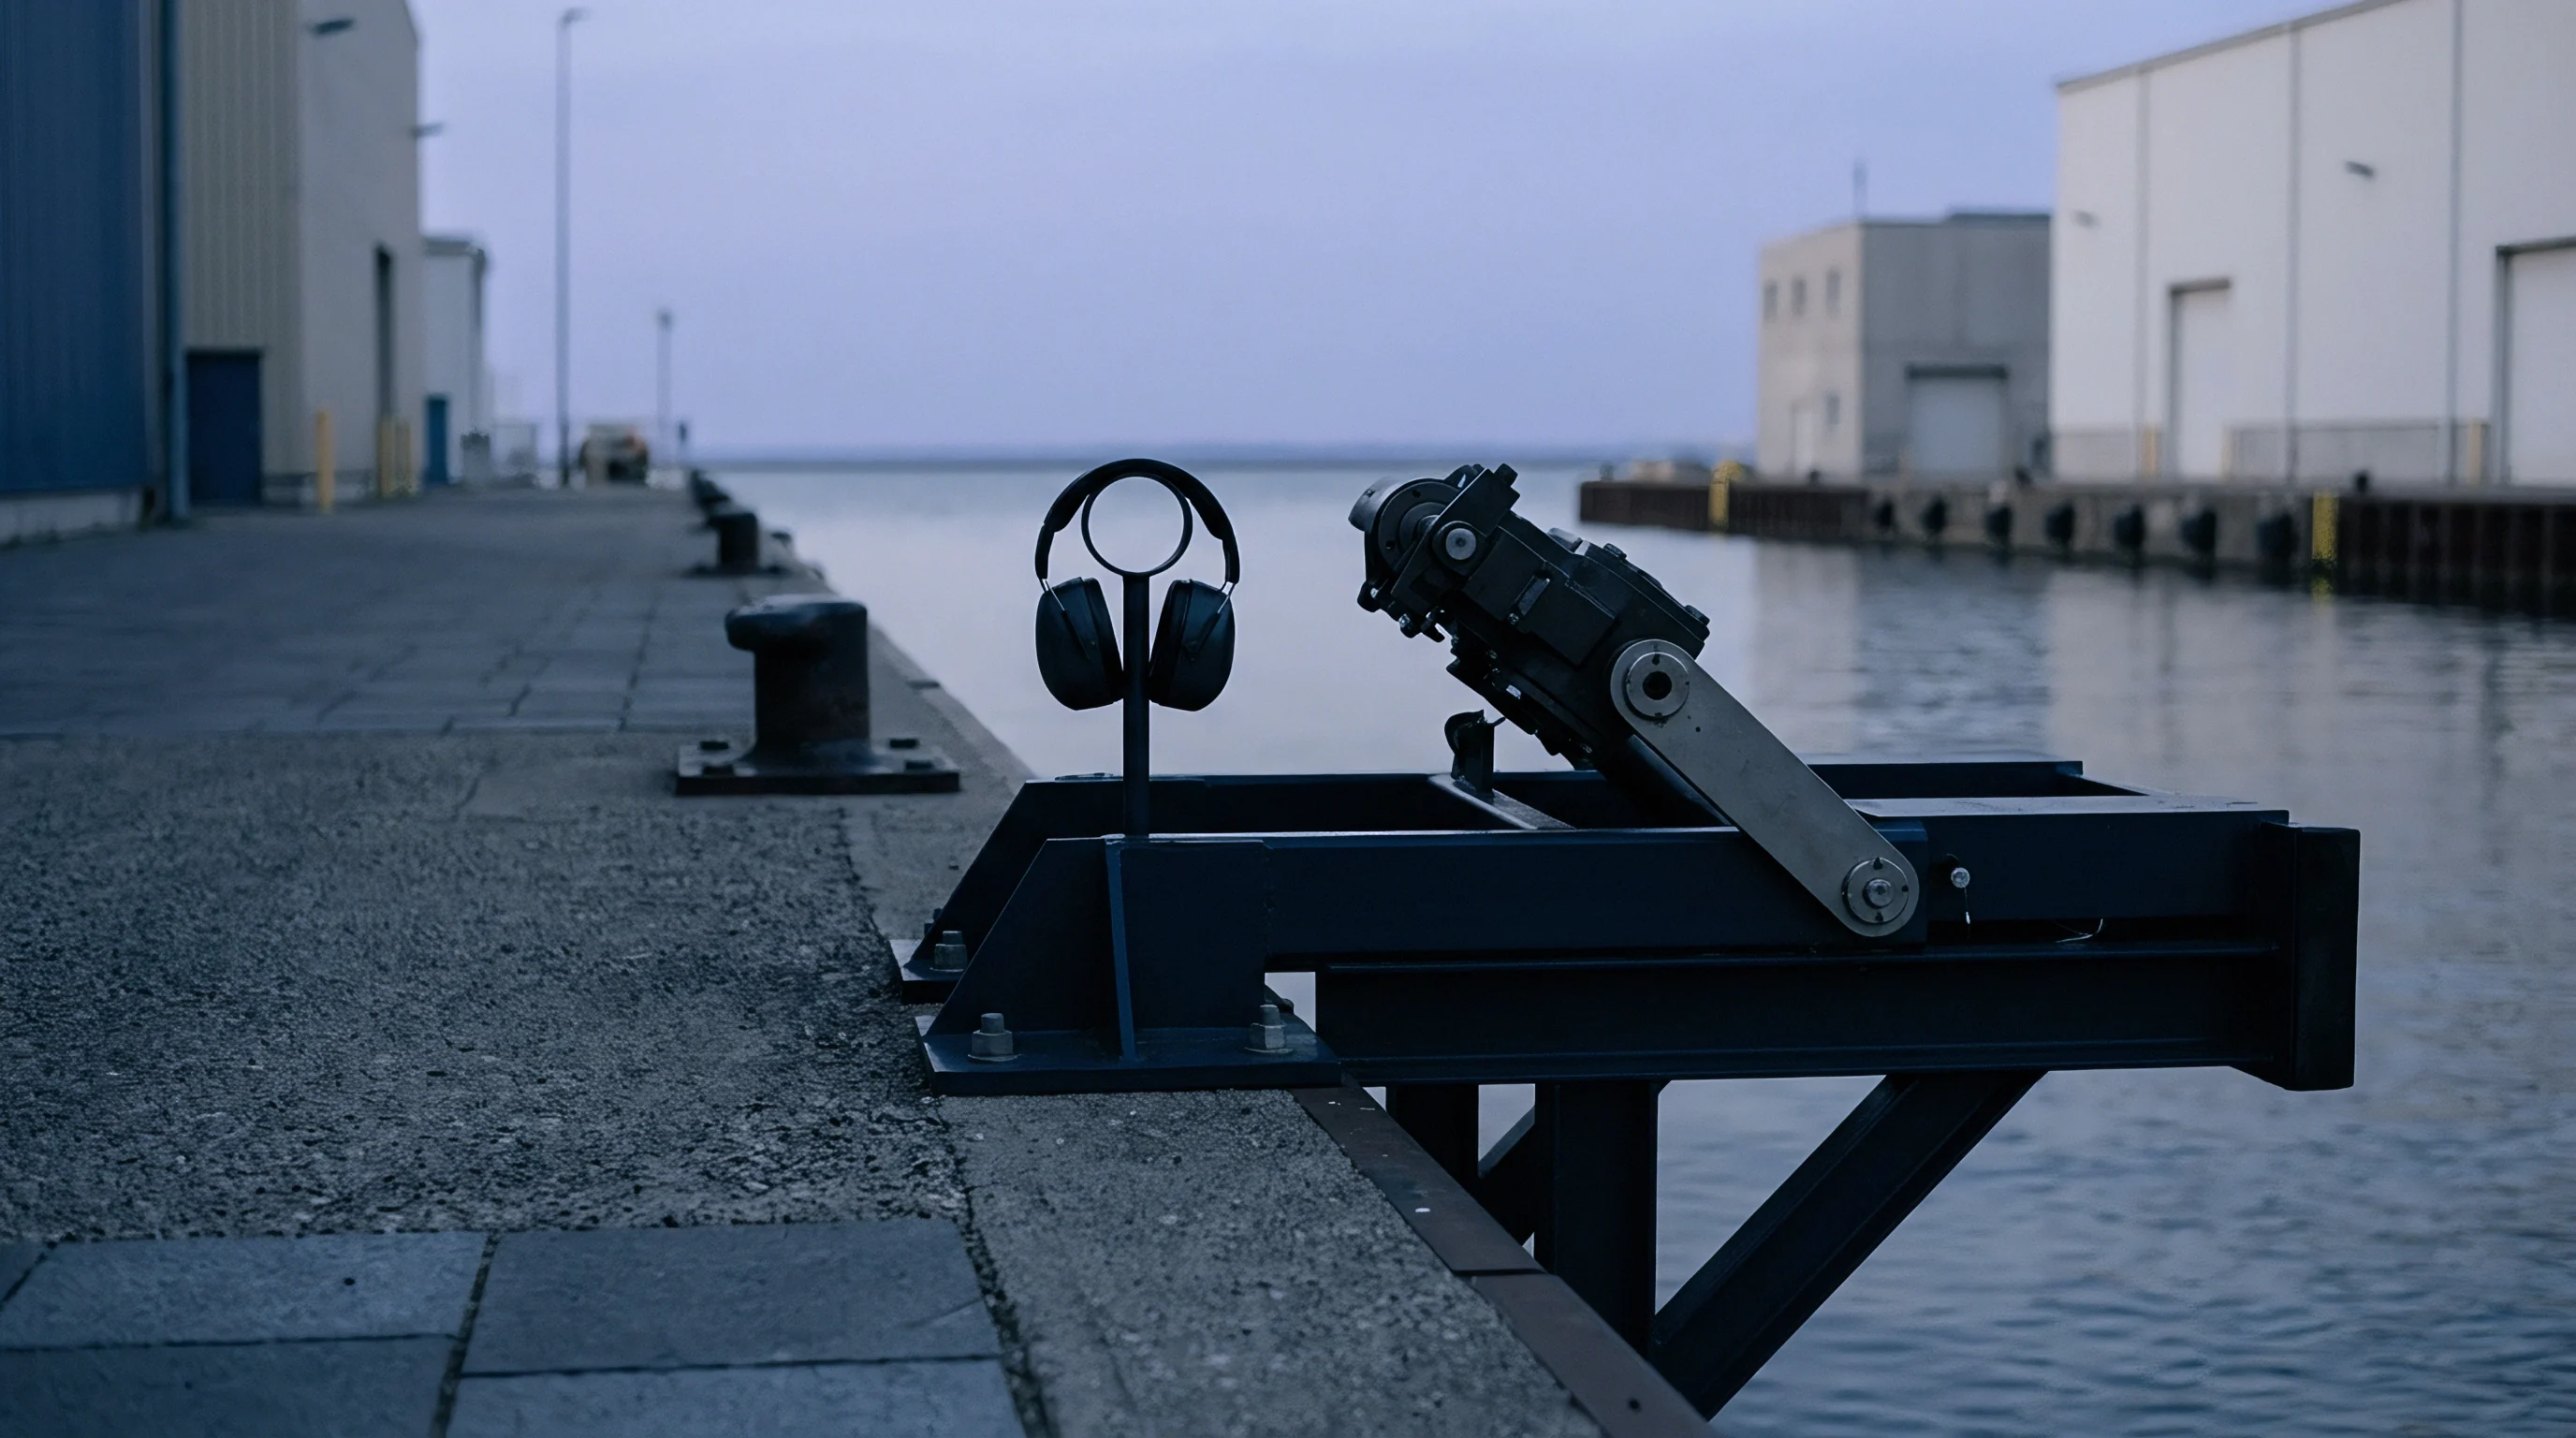
Protective earmuffs rest on a metal stand beside a specialized monitoring instrument mounted on a concrete dock along an industrial waterway.

Verdict

Buyers must budget for extra drayage fees and add seven days to standard transit estimates for all West Coast entries through November.

Nomenclature

Port Operations

Handling Scope ~ Maritime terminal productivity defines the total throughput velocity of cargo transfers measured through the integration of crane cycles, berthing schedules and horizontal transport systems.

Intermodal Congestion

Queue Bottleneck ~ Intermodal congestion designates a systemic paralysis occurring where freight transfers between maritime vessels, railcars and trucks at inland and coastal terminals.

Supply Chain Visibility

Data Transparency ~ Tracking material movement across international transit points allows firms to monitor supply chain visibility through real time digital logs.

Warehouse Capacity

Total Volume ~ Storage limits define the maximum quantity of goods a facility holds while maintaining safe operational standards.

Freight Procurement

Vendor Selection ~ Cargo capacity sourcing identifies the specific negotiation and contracting actions undertaken by organizations to secure external transportation services for the movement of goods through global supply chains.

Arrival Delays

Operational Variance ~ Cargo transit schedules measure the time elapsed between departure and the actual physical positioning of a vessel or vehicle at its designated terminal.

Transpacific Trade

Maritime Route ~ Transpacific trade defines the massive movement of manufactured goods and raw materials across the Pacific Ocean, bridging the production centers of East Asia with the consumer markets of North America.

Spot Rate Volatility

Price Dispersion ~ Daily fluctuations in the cost to secure immediate shipping capacity represent the primary financial metric for evaluating short-term logistics risk.

Drayage Costs

Operational Expense ~ Transport expenditure covering short-haul container movement between maritime terminals and inland distribution hubs constitutes a distinct category within freight logistics.

Inland Transit

Movement Path ~ Terrestrial freight movement connects coastal entry points with domestic distribution centers and final production sites.

Trucking Equipment Shortages

Fleet Deficit ~ Equipment availability problems across highway networks govern freight movement when trailers or power units fail to match shipping demands.

Container Yards

Yard Throughput ~ Industrial facilities holding stacked metal boxes measure terminal velocity by counting twenty-foot equivalent units moving across the gate every hour, and container yards function as the physical buffers where cargo boxes wait between modal legs.

What the firm knows, published

Expertise is a utility, not a secret. sentiention™ publishes its working knowledge as open reference: intelligence layer covering the materials it sources, the markets it enters, and the reference that serves both.